
Solutions
Focus Fidelity software analyses impulse response measurements taken at multiple positions in the listening area to build a time-domain accurate mathematical model of the loudspeaker-input-to-listening-area "response" or transfer function. The model enables the identification of resonant modes, phase distortions and reverberant field tonal balance, and factors that should not be corrected. The input to the filter design process is the model analysis combined with the user-specified target magnitude frequency response.
Audio playback through the filter combines with the now known (through measurements) loudspeaker and room characteristics to produce a total result that is substantially closer to the frequency and time domain targets set by the user. The filter is particularly effective at,
- reducing the decay time of resonances caused by standing waves (room modes)
- reversing loudspeaker phase and impulse distortions
- controlling tonal balance
Our software does not attempt aggressive correction that would be highly position dependent or produce filters with significant "ringing", especially pre-ringing.
Room Resonant Modes
Acoustic resonances exist in an enclosed space due to sound waves travelling between opposite boundaries. These resonances store energy which takes time to dissipate. This time to dissipate is often called decay time. The left image below shows sound decay in a room between 30Hz and 200Hz. Strong resonant modes are visible at 52Hz and 68Hz, with more minor modes at higher frequencies. The image on the right shows the result of combining the correction filter with the room. The filter precisely matches the time domain behaviour of the resonant modes, reducing the room's excitation at the resonant frequencies. The net result is reduced decay time which is now much more consistent across the frequency range.


Impulse Response
Loudspeakers introduce a time delay that changes across the audio spectrum. This delay is due to the phase shift of crossover networks and the different positions of the acoustic centres of the various drivers employed in a typical multi-way loudspeaker design. The images below show the impulse and step responses of a 2-way horn loudspeaker. Due to the depth of the tweeter horn, the sound from the woofer arrives at the listening position before the tweeter. A properly designed filter can correct this and restore waveform fidelity, most easily seen in the "After" step response (right-hand image below). The tweeter and woofer are now seamlessly integrated.


Workflow
Performing measurements is the first step in generating room correction filters. Focus Fidelity's impulse response measurement software, Impala, makes this quick and easy. Impala saves the measurements to a single file which you import into the filter design application.
The filter design software follows a "wizard" style left to right type workflow, beginning with project creation and ending with exporting the filters and viewing predicted results at each measurement position. At each step in the workflow, some user input is required.
Performing Measurements

Using Impala, measurements of the left and right channels are taken at multiple positions. The first measurement you will perform is at the central position. This position is the centre (“sweet spot”) of the listening area, with the microphone at the height your ears would be. You should arrange the remaining microphone positions symmetrically around the central position with variations in height. The measurement positions should cover the intended listening area, for example, the width of a sofa. You can use a tighter spacing for a single-seat listening arrangement.
Target Magnitude

The target magnitude is the desired magnitude vs frequency response and will determine the tonal balance across the audio spectrum. The correct target magnitude is the one that sounds best to you, and arriving at one may require a few iterations and listening sessions. We recommend starting with a target that follows the general trend of the measurements and changing it from there based on listening tests. The filter design software will initially set the target as a sloping straight line with slope and level fitted through the measurement data.
The target magnitude editor includes adjustment of the overall target level and slope, high and low pass slopes and corner frequencies, a second adjustable slope, and moveable control points. The slope adjustments are usually enough to quickly design a target while the control points allow for detailed adjustment if required.
Results View


The predicted “corrected” response at each measurement position can be viewed. The predicted response at each position is calculated by applying the filter to each of the original measurements.
Filter Export
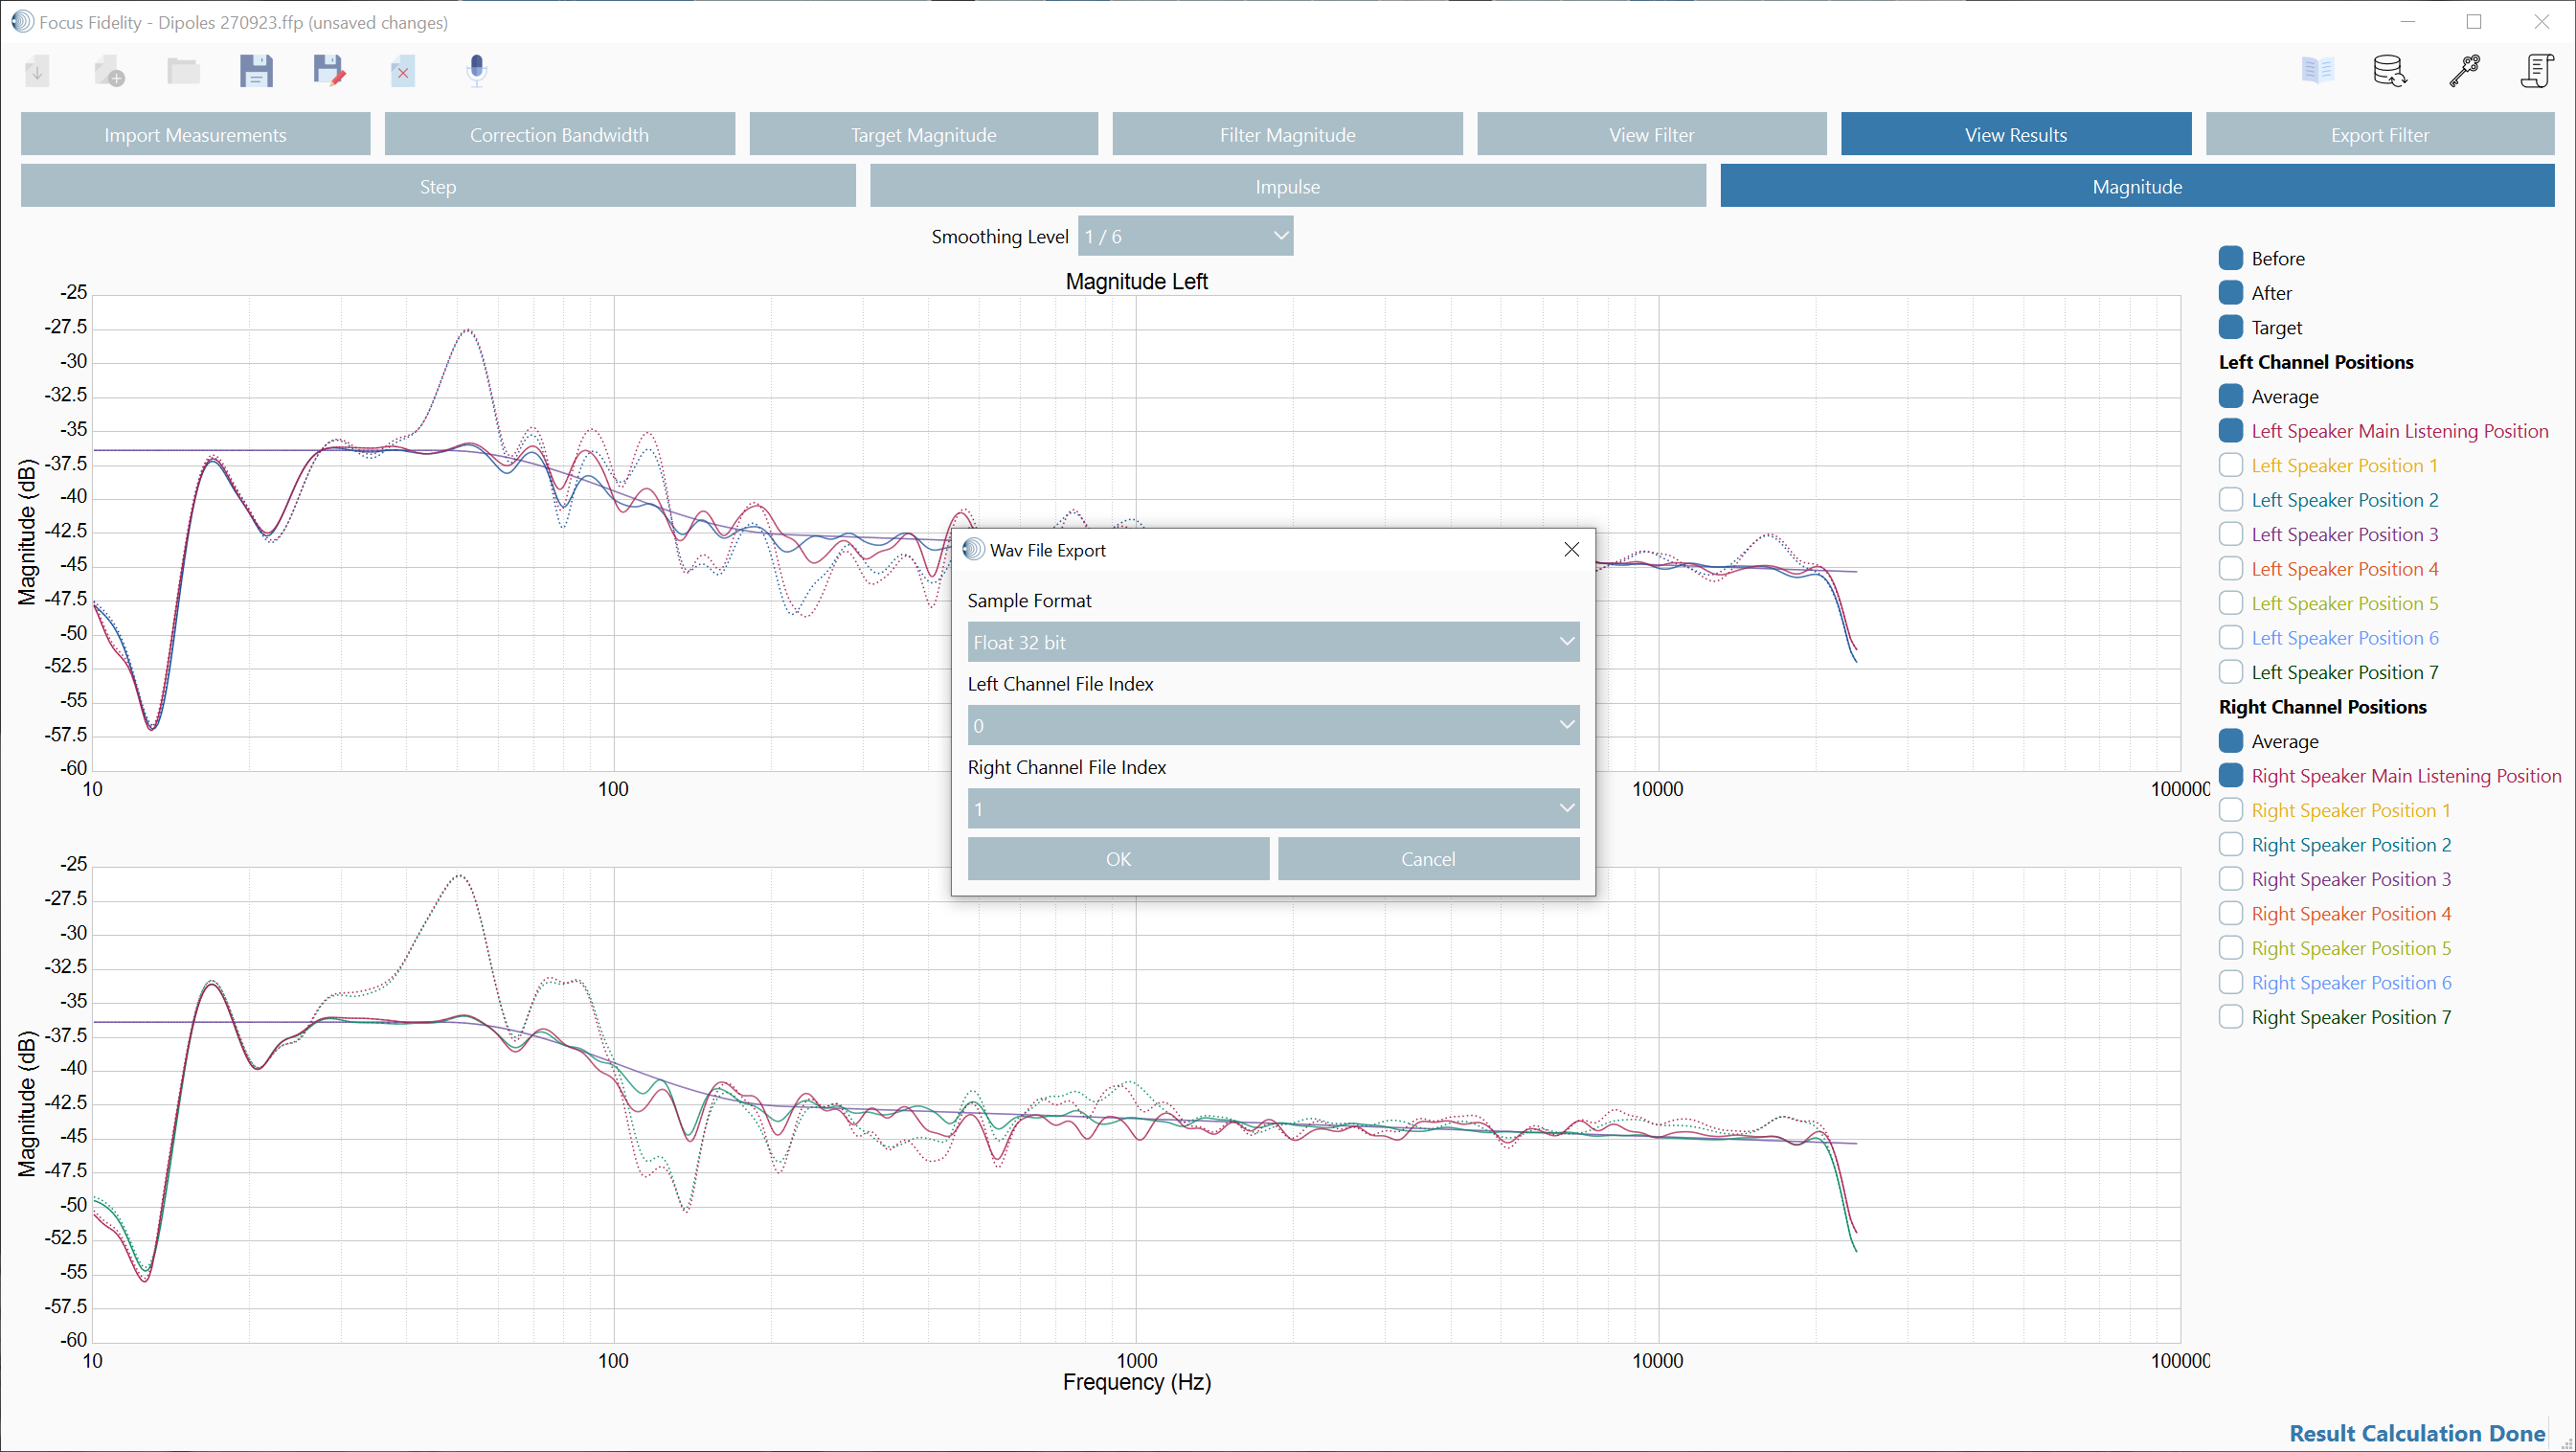
Our filter design software generates filters at sample rates of 44.1, 48, 88.2, 96, 176.4, 192, 352.8 and 384kS/s. These sample rates are generated regardless of the sample rate of the original measurements. The filters are exported as 2 channel wav files, one file for each sample rate. The filter wav files can be imported into playback software with a filter (convolution) capability such as Accurate Sound's HLC, Roon, JRiver Media Center, and HQPlayer. The filter design software user manual provides details of configuration with Roon, JRiver & HLC.
Download our freeware measurement application for Microsoft Windows and macOS here,
For updates on the latest releases, development progress & new products,